In today’s digital ecosystem, where performance and reliability are critical, monitoring your computer’s internal hardware has become essential. Whether you are a gamer, developer, student, or IT professional, maintaining optimal system health ensures consistent performance and longevity.
This is where openhardwaremonitor.com stands out as a powerful yet lightweight solution. It offers real-time tracking of key hardware metrics such as CPU temperature, GPU usage, fan speeds, and voltage levels—all without consuming significant system resources.
In India, where high ambient temperatures and prolonged usage often stress computer systems, tools like Open Hardware Monitor are particularly valuable. Overheating is one of the leading causes of hardware degradation, and early detection can prevent expensive repairs or replacements.
This comprehensive guide explores everything you need to know about openhardwaremonitor.com, including features, installation, comparisons, and practical use cases tailored for Indian users.
What is OpenHardwareMonitor.com?
Openhardwaremonitor.com is the official platform for downloading Open Hardware Monitor, an open-source application designed to monitor hardware components in real time.
Unlike many proprietary tools, this software is completely free and does not require installation. It runs as a portable executable file, making it highly convenient for users who prefer minimal system clutter.
Key Characteristics:
- Open-source software
- Lightweight and portable
- Real-time hardware monitoring
- Compatible with most Windows systems
The software reads data from system sensors and presents it in a structured format, allowing users to diagnose issues quickly and effectively.
Core Features and Capabilities
- CPU Monitoring
The CPU is the most critical component of any system. Open Hardware Monitor provides detailed insights such as:
- Core-wise temperature readings
- CPU load percentage
- Clock speeds (MHz)
Monitoring CPU temperature is especially important in India due to heat-related throttling risks.
- GPU Monitoring
For gamers and graphic designers, GPU monitoring is crucial. Features include:
- GPU temperature
- Memory usage
- Load percentage
Although support for very new GPUs may be limited, it works reliably for most mainstream cards.
- Storage Monitoring
The tool reads SMART (Self-Monitoring, Analysis, and Reporting Technology) data to provide:
- HDD/SSD temperatures
- Health indicators
- Error rates
- Voltage Monitoring
Voltage fluctuations can damage hardware. Open Hardware Monitor tracks:
- CPU core voltage
- 3.3V, 5V, and 12V rails
- Fan Speed Monitoring
Proper airflow is essential. The software displays:
- Fan speeds in RPM
- Cooling efficiency indicators
- Remote Monitoring
Advanced users can enable remote access:
- Monitor systems over a network
- Useful for IT administrators
Supported Hardware Overview
| Hardware Component | Monitoring Capability | Remarks |
| CPU (Intel/AMD) | Temperature, Load, Clock | Highly accurate |
| GPU (NVIDIA/AMD) | Temperature, Load | Limited newer GPU support |
| HDD/SSD | Temperature, Health | SMART-based |
| Motherboard | Voltage, Fan Speed | Depends on chipset |
| RAM | Minimal | No direct temp monitoring |
How to Download and Install OpenHardwareMonitor.com
Step 1: Access the Website
Visit the official website:
https://openhardwaremonitor.com
Step 2: Download the Software
Click on the download link. The file size is extremely small, making it ideal even for slow internet connections in rural India.
Step 3: Extract the ZIP File
Use tools like:
- WinRAR
- 7-Zip
- Windows built-in extractor
Step 4: Run the Application
- Open the extracted folder
- Double-click OpenHardwareMonitor.exe
- Run as administrator for best results
Installation Summary Table
| Step | Description | Time |
| Download | From official site | 1–2 minutes |
| Extract | Unzip files | <1 minute |
| Launch | Run executable | Instant |
System Requirements
Open Hardware Monitor is designed for efficiency and works on low-end systems as well.
| Component | Requirement |
| Operating System | Windows 7, 8, 10, 11 |
| RAM | 512 MB minimum |
| Storage | Less than 10 MB |
| Processor | Any modern CPU |
| Permissions | Admin access recommended |
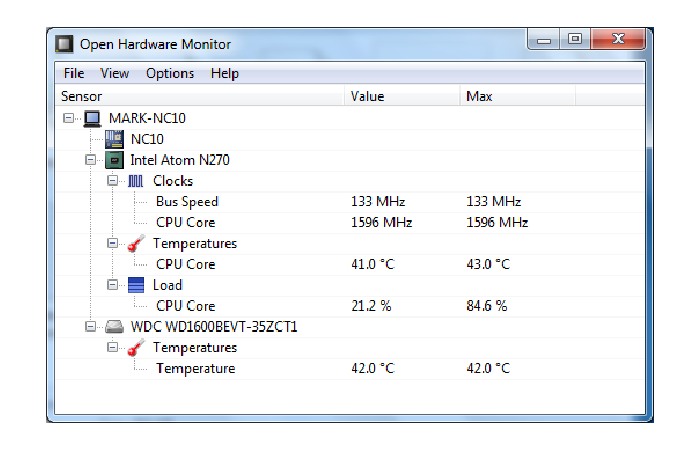
User Interface Walkthrough
The interface is intentionally minimalistic, prioritizing functionality over aesthetics.
Key Sections
- Sensor Tree Structure
Displays hardware components in a hierarchical format:
- CPU → cores → temperatures
- GPU → load → memory usage
- Real-Time Updates
Values refresh continuously, providing accurate monitoring.
- Graph Visualization
Users can:
- Plot temperature trends
- Track performance spikes
- System Tray Integration
You can pin specific metrics (e.g., CPU temp) to the taskbar for quick access.
- Customization Options
- Rename sensors
- Hide unnecessary data
- Rearrange components
Comparison with Alternative Tools
Feature Comparison Table
| Feature | Open Hardware Monitor | HWMonitor | MSI Afterburner | HWiNFO |
| Price | Free | Free/Paid | Free | Free |
| Open Source | Yes | No | No | No |
| Installation | Not required | Required | Required | Required |
| GPU Monitoring | Basic | Moderate | Advanced | Advanced |
| UI Simplicity | High | Medium | Medium | Low |
| Advanced Analytics | Limited | Moderate | High | Very High |
Analysis
- Open Hardware Monitor is best for beginners and minimalists
- HWiNFO suits advanced diagnostics
- MSI Afterburner is ideal for gamers needing GPU tuning
Use Cases for Indian Users
- Managing Heat in Indian Climate
Indian temperatures often exceed 40°C, increasing the risk of:
- Thermal throttling
- Hardware failure
Monitoring helps maintain safe operating conditions.
- Budget PC Optimization
Many Indian users build cost-effective PCs. This tool helps:
- Identify overheating components
- Improve cooling efficiency
- Gaming Performance Monitoring
Gamers can track:
- GPU load
- CPU bottlenecks
- Temperature spikes
- Laptop Maintenance
Compact laptops are prone to overheating. Monitoring helps:
- Detect ventilation issues
- Improve longevity
- Professional Use
IT professionals and developers can:
- Monitor servers
- Diagnose system issues
Troubleshooting Common Issues
Issue 1: Sensors Not Displaying
Solution: Run as administrator
Issue 2: GPU Not Detected
Solution: Use alternative tools like HWiNFO
Issue 3: Incorrect Readings
Solution: Cross-check with BIOS
Issue 4: Software Crashes
Solution:
- Update .NET Framework
- Run in compatibility mode
Pros and Cons
Advantages
- Free and open-source
- Lightweight and portable
- Easy to use
- No installation required
- Real-time monitoring
Disadvantages
- Limited updates
- Basic interface
- Not ideal for advanced users
- Partial support for new hardware
Advanced Tips for Better Usage
- Add to startup for continuous monitoring
- Use tray icons for quick access
- Combine with cooling pads or external fans
- Regularly check idle vs load temperatures
Real-Life Example (India Scenario)
A student in Hyderabad using a mid-range laptop experiences lag during online classes and gaming.
Using Open Hardware Monitor:
- CPU temperature: 92°C
- Fan speed: Low
Action:
- Cleaned internal fans
- Used cooling pad
Result:
- Temperature reduced to 78°C
- Improved system performance
Conclusion
Openhardwaremonitor.com provides a simple yet powerful solution for monitoring system health. Its lightweight nature, ease of use, and zero cost make it highly suitable for Indian users dealing with high temperatures and budget constraints.
While it may lack advanced analytics, it excels in delivering essential monitoring features efficiently. For most users, especially beginners, it offers everything needed to maintain system performance and prevent hardware issues.
Call to Action
If you want to safeguard your system from overheating and performance issues, visit openhardwaremonitor.com today. Download the tool, monitor your hardware, and take control of your PC’s health before problems arise.